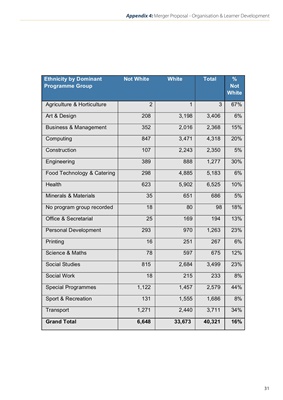
Ethnicity by Dominant
Programme Group
Not White White Total %
Not
White
Agriculture & Horticulture 2 1 3 67%
Art & Design 208 3,198 3,406 6%
Business & Management 352 2,016 2,368 15%
Computing 847 3,471 4,318 20%
Construction 107 2,243 2,350 5%
Engineering 389 888 1,277 30%
Food Technology & Catering 298 4,885 5,183 6%
Health 623 5,902 6,525 10%
Minerals & Materials 35 651 686 5%
No program group recorded 18 80 98 18%
Office & Secretarial 25 169 194 13%
Personal Development 293 970 1,263 23%
Printing 16 251 267 6%
Science & Maths 78 597 675 12%
Social Studies 815 2,684 3,499 23%
Social Work 18 215 233 8%
Special Programmes 1,122 1,457 2,579 44%
Sport & Recreation 131 1,555 1,686 8%
Transport 1,271 2,440 3,711 34%
Grand Total 6,648 33,673 40,321 16%
Appendix 4: Merger Proposal - Organisation & Learner Development
31