9
The value of college graduates to the Scottish economy, September 2017
Table 6: Enrolments for students from a minority ethnic background 2015/16
Ethnic background Funded by SFC Funded from other sources
African 4,385 838
Pakistani 2,588 246
Other ethnic background 2,435 547
Any other Asian background 1,841 174
Chinese 1,335 141
Any mixed background 1,127 194
Indian 815 1,234
Other black background 436 44
Bangladeshi 187 31
Caribbean 177 26
Total 15,326 3,375
Source: Scottish Funding Council
In 2015/16, enrolments from students with a minority ethnic background accounted for 6.7% of total
enrolments.
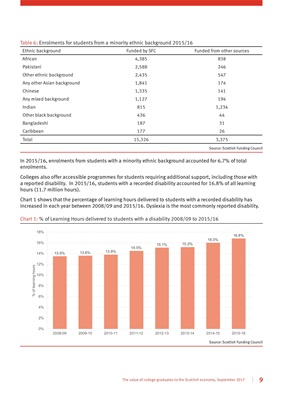
Colleges also offer accessible programmes for students requiring additional support, including those with
a reported disability. In 2015/16, students with a recorded disability accounted for 16.8% of all learning
hours (11.7 million hours).
Chart 1 shows that the percentage of learning hours delivered to students with a recorded disability has
increased in each year between 2008/09 and 2015/16. Dyslexia is the most commonly reported disability.
Chart 1: % of Learning Hours delivered to students with a disability 2008/09 to 2015/16
13.5% 13.6% 13.8%
14.5%
15.1% 15.2%
16.0%
16.8%
0%
2%
4%
6%
8%
10%
12%
14%
16%
18%
2008-09 2009-10 2010-11 2011-12 2012-13 2013-14 2014-15 2015-16
% of learning hours
Source: Scottish Funding Council