8 Fraser of Allander Institute
In addition to headcount and the number of FTE students, it is also possible to measure enrolments at
college. Enrolments tend to be higher than headcount and FTE as it is possible for people to sign-up for
more than one course.
The majority of enrolments are on part-time courses reflecting, in part, the flexible nature of learning in
the sector. In 2015/16, 65.9% of the sector's 281,051 enrolments were part-time. In total, the 227,258
students attending college in 2015/16 are estimated to have achieved more than 70 million hours, or 8,000
years, of learning2.
The gender balance of the student population is relatively even at 49% male to 51% female. At a subject
level, some gender imbalances persist e.g. engineering and social care. The Scottish Funding Council (SFC)
has developed a Gender Action Plan in partnership with key stakeholders to address this across the tertiary
sector.
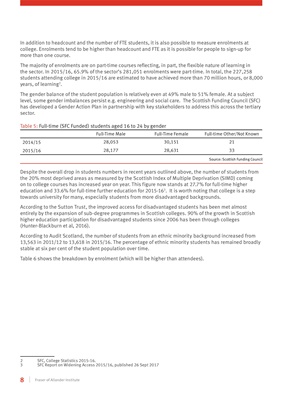
Table 5: Full-time (SFC Funded) students aged 16 to 24 by gender
Full-Time Male Full-Time Female Full-time Other/Not Known
2014/15 28,053 30,151 21
2015/16 28,177 28,631 33
Source: Scottish Funding Council
Despite the overall drop in students numbers in recent years outlined above, the number of students from
the 20% most deprived areas as measured by the Scottish Index of Multiple Deprivation (SIMD) coming
on to college courses has increased year on year. This figure now stands at 27.7% for full-time higher
education and 33.6% for full-time further education for 2015-163. It is worth noting that college is a step
towards university for many, especially students from more disadvantaged backgrounds.
According to the Sutton Trust, the improved access for disadvantaged students has been met almost
entirely by the expansion of sub-degree programmes in Scottish colleges. 90% of the growth in Scottish
higher education participation for disadvantaged students since 2006 has been through colleges
(Hunter-Blackburn et al, 2016).
According to Audit Scotland, the number of students from an ethnic minority background increased from
13,563 in 2011/12 to 13,618 in 2015/16. The percentage of ethnic minority students has remained broadly
stable at six per cent of the student population over time.
Table 6 shows the breakdown by enrolment (which will be higher than attendees).
2 SFC, College Statistics 2015-16.
3 SFC Report on Widening Access 2015/16, published 26 Sept 2017