30 Fraser of Allander Institute
Appendix A: Estimating the Productivity Impact of College Graduates
This appendix outlines the calculation required to identify the scale of the labour productivity 'shock' that
is entered into the CGE model; this is simply the increase in the productivity of the Scottish labour force
attributable to the college graduates in that year. The approach taken follows closely that of Hermannsson
et al. (2017). The year selected in this analysis is 2015/16 (these are the most up-to-date data available at
the time of writing this analysis). The following details the calculations necessary to identify the impacts of
college graduates in terms of efficiency units of labour.
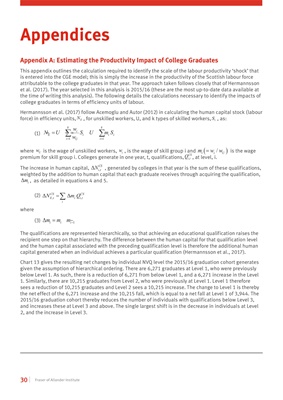
Hermannsson et al. (2017) follow Acemoglu and Autor (2012) in calculating the human capital stock (labour
force) in efficiency units, , for unskilled workers, U, and k types of skilled workers, , as:
(1) 11
kk
i
E i ii
ii
U
w
N U S U mS
w
where Uw is the wage of unskilled workers, iw , is the wage of skill group i and ( )/i iU
m ww= is the wage
premium for skill group i. Colleges generate in one year, t, qualifications, , at level, i.
The increase in human capital, ,Δ CS
itN , generated by colleges in that year is the sum of these qualifications,
weighted by the addition to human capital that each graduate receives through acquiring the qualification,
, as detailed in equations 4 and 5.
(2) ,,
Δ Δ
CS CS
Et i it
i
N mQ=∑
where
(3)
1
Δ i ii
mmm−= −
The qualifications are represented hierarchically, so that achieving an educational qualification raises the
recipient one step on that hierarchy. The difference between the human capital for that qualification level
and the human capital associated with the preceding qualification level is therefore the additional human
capital generated when an individual achieves a particular qualification (Hermannsson et al., 2017).
Chart 13 gives the resulting net changes by individual NVQ level the 2015/16 graduation cohort generates
given the assumption of hierarchical ordering. There are 6,271 graduates at Level 1, who were previously
below Level 1. As such, there is a reduction of 6,271 from below Level 1, and a 6,271 increase in the Level
1. Similarly, there are 10,215 graduates from Level 2, who were previously at Level 1. Level 1 therefore
sees a reduction of 10,215 graduates and Level 2 sees a 10,215 increase. The change to Level 1 is thereby
the net effect of the 6,271 increase and the 10,215 fall, which is equal to a net fall at Level 1 of 3,944. The
2015/16 graduation cohort thereby reduces the number of individuals with qualifications below Level 3,
and increases these at Level 3 and above. The single largest shift is in the decrease in individuals at Level
2, and the increase in Level 3.
Appendices
EN iS
,
CS
itQ
Δ im