31
The value of college graduates to the Scottish economy, September 2017
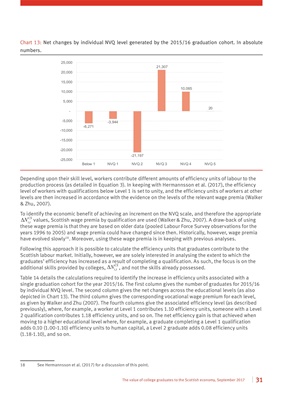
Chart 13: Net changes by individual NVQ level generated by the 2015/16 graduation cohort. In absolute
numbers.
-6,271
-3,944
-21,197
21,307
10,085
20
-25,000
-20,000
-15,000
-10,000
-5,000
-
5,000
10,000
15,000
20,000
25,000
Below 1 NVQ 1 NVQ 2 NVQ 3 NVQ 4 NVQ 5
Depending upon their skill level, workers contribute different amounts of efficiency units of labour to the
production process (as detailed in Equation 3). In keeping with Hermannsson et al. (2017), the efficiency
level of workers with qualifications below Level 1 is set to unity, and the efficiency units of workers at other
levels are then increased in accordance with the evidence on the levels of the relevant wage premia (Walker
& Zhu, 2007).
To identify the economic benefit of achieving an increment on the NVQ scale, and therefore the appropriate
values, Scottish wage premia by qualification are used (Walker & Zhu, 2007). A draw-back of using
these wage premia is that they are based on older data (pooled Labour Force Survey observations for the
years 1996 to 2005) and wage premia could have changed since then. Historically, however, wage premia
have evolved slowly18. Moreover, using these wage premia is in keeping with previous analyses.
Following this approach it is possible to calculate the efficiency units that graduates contribute to the
Scottish labour market. Initially, however, we are solely interested in analysing the extent to which the
graduates' efficiency has increased as a result of completing a qualification. As such, the focus is on the
additional skills provided by colleges, , and not the skills already possessed.
Table 14 details the calculations required to identify the increase in efficiency units associated with a
single graduation cohort for the year 2015/16. The first column gives the number of graduates for 2015/16
by individual NVQ level. The second column gives the net changes across the educational levels (as also
depicted in Chart 13). The third column gives the corresponding vocational wage premium for each level,
as given by Walker and Zhu (2007). The fourth columns give the associated efficiency level (as described
previously), where, for example, a worker at Level 1 contributes 1.10 efficiency units, someone with a Level
2 qualification contributes 1.18 efficiency units, and so on. The net efficiency gain is that achieved when
moving to a higher educational level where, for example, a graduate completing a Level 1 qualification
adds 0.10 (1.00-1.10) efficiency units to human capital, a Level 2 graduate adds 0.08 efficiency units
(1.18-1.10), and so on.
18 See Hermannsson et al. (2017) for a discussion of this point.
,Δ CS
itN
,Δ CS
itN