32 Fraser of Allander Institute
Colleges create 6,271 Level 1 graduates with an efficiency level of 1.10. We presume these were below
Level 1 previously with an efficiency unit weighting of 1.00. The total increment by level, as measured in
efficiency units, reflects the net effect of two changes. There is a fall of -6,271 (-6,271*1.00) of these below
Level 1, and a rise of 6,891 (6,271*1.10) as they graduate in Level 1. As FECs create 10,215 graduates at
Level 2, who we presume were at Level 1 previously, there is a fall of 11,237 (10,215*1.10) at Level 2. The
net change at Level 1 is thereby a fall of 4,338 efficiency units (6,898-11,237 i.e. the rise in efficiency units
generated by Level 1 graduates minus the fall generated by Level 2 graduates). These calculations are
repeated for the remaining levels.
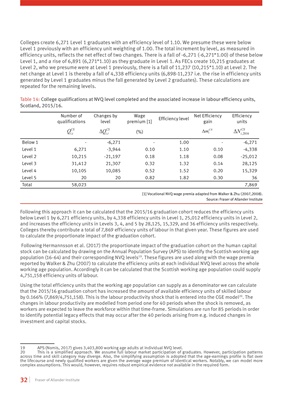
Table 14: College qualifications at NVQ level completed and the associated increase in labour efficiency units,
Scotland, 2015/16.
Number of
qualifications
Changes by
level
Wage
premium [1]
Efficiency level
Net Efficiency
gain
Efficiency
units
,
CS
itQ ,Δ CS
itQ (%) Δ CS
im ,2016Δ CS
iN
Below 1 - -6,271 - 1.00 - -6,271
Level 1 6,271 -3,944 0.10 1.10 0.10 -4,338
Level 2 10,215 -21,197 0.18 1.18 0.08 -25,012
Level 3 31,412 21,307 0.32 1.32 0.14 28,125
Level 4 10,105 10,085 0.52 1.52 0.20 15,329
Level 5 20 20 0.82 1.82 0.30 36
Total 58,023 7,869
[1] Vocational NVQ wage premia adapted from Walker & Zhu (2007,2008).
Source: Fraser of Allander Institute
Following this approach it can be calculated that the 2015/16 graduation cohort reduces the efficiency units
below Level 1 by 6,271 efficiency units, by 4,338 efficiency units in Level 1, 25,012 efficiency units in Level 2,
and increases the efficiency units in Levels 3, 4, and 5 by 28,125, 15,329, and 36 efficiency units respectively.
Colleges thereby contribute a total of 7,869 efficiency units of labour in that given year. These figures are used
to calculate the proportionate impact of the graduation cohort.
Following Hermannsson et al. (2017) the proportionate impact of the graduation cohort on the human capital
stock can be calculated by drawing on the Annual Population Survey (APS) to identify the Scottish working age
population (16-64) and their corresponding NVQ levels19. These figures are used along with the wage premia
reported by Walker & Zhu (2007) to calculate the efficiency units at each individual NVQ level across the whole
working age population. Accordingly it can be calculated that the Scottish working age population could supply
4,751,158 efficiency units of labour.
Using the total efficiency units that the working age population can supply as a denominator we can calculate
that the 2015/16 graduation cohort has increased the amount of available efficiency units of skilled labour
by 0.166% (7,869/4,751,158). This is the labour productivity shock that is entered into the CGE model20. The
changes in labour productivity are modelled from period one for 40 periods when the shock is removed, as
workers are expected to leave the workforce within that time-frame. Simulations are run for 85 periods in order
to identify potential legacy effects that may occur after the 40 periods arising from e.g. induced changes in
investment and capital stocks.
19 APS (Nomis, 2017) gives 3,403,800 working age adults at individual NVQ level.
20 This is a simplified approach. We assume full labour market participation of graduates. However, participation patterns
across time and skill category may diverge. Also, the simplifying assumption is adopted that the age-earnings profile is flat over
the lifecourse and newly qualified workers are given the average wage premium of identical workers. Notably, we can model more
complex assumptions. This would, however, requires robust empirical evidence not available in the required form.