28 Fraser of Allander Institute
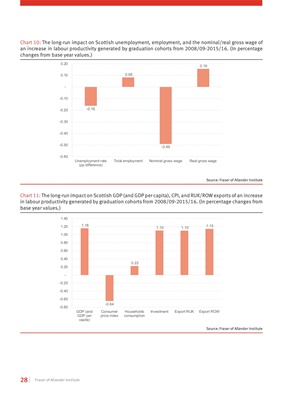
Chart 10: The long-run impact on Scottish unemployment, employment, and the nominal/real gross wage of
an increase in labour productivity generated by graduation cohorts from 2008/09-2015/16. (In percentage
changes from base year values.)
-0.16
0.08
-0.49
0.16
-0.60
-0.50
-0.40
-0.30
-0.20
-0.10
-
0.10
0.20
Unemployment rate
(pp difference)
Total employment Nominal gross wage Real gross wage
Source: Fraser of Allander Institute
Chart 11: The long-run impact on Scottish GDP (and GDP per capita), CPI, and RUK/ROW exports of an increase
in labour productivity generated by graduation cohorts from 2008/09-2015/16. (In percentage changes from
base year values.)
1.16
-0.64
0.22
1.10 1.10
1.15
-0.80
-0.60
-0.40
-0.20
-
0.20
0.40
0.60
0.80
1.00
1.20
1.40
GDP (and
GDP per
capita)
Consumer
price index
Households
consumption
Investment Export RUK Export ROW
Source: Fraser of Allander Institute