93
City of Glasgow College Annual Report & Accounts 2020-21
SIMD
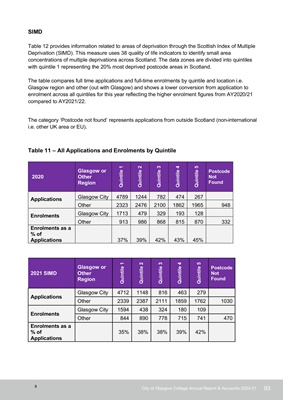
Table 12 provides information related to areas of deprivation through the Scottish Index of Multiple
Deprivation (SIMD). This measure uses 38 quality of life indicators to identify small area
concentrations of multiple deprivations across Scotland. The data zones are divided into quintiles
with quintile 1 representing the 20% most deprived postcode areas in Scotland.
The table compares full time applications and full-time enrolments by quintile and location i.e.
Glasgow region and other (out with Glasgow) and shows a lower conversion from application to
enrolment across all quintiles for this year reflecting the higher enrolment figures from AY2020/21
compared to AY2021/22.
The category 'Postcode not found' represents applications from outside Scotland (non-international
i.e. other UK area or EU).
Table 11 - All Applications and Enrolments by Quintile
2020
Glasgow or
Other
Region Quintile 1
Quintile 2
Quintile 3
Quintile 4
Quintile 5
Postcode
Not
Found
Applications Glasgow City 4789 1244 782 474 267
Other 2323 2476 2100 1862 1965 948
Enrolments Glasgow City 1713 479 329 193 128
Other 913 986 868 815 870 332
Enrolments as a
% of
Applications 37% 39% 42% 43% 45%
2021 SIMD
Glasgow or
Other
Region Quintile 1
Quintile 2
Quintile 3
Quintile 4
Quintile 5
Postcode
Not
Found
Applications
Glasgow City 4712 1148 816 463 279
Other 2339 2387 2111 1859 1762 1030
Enrolments
Glasgow City 1594 438 324 180 109
Other 844 890 778 715 741 470
Enrolments as a
% of
Applications
35% 38% 38% 39% 42%
8